How to use Google Analytics with Tanaza splash page

Tanaza features a splash page editor that enables WiFi network administrators to configure their captive portal by adding a logo, text, redirection links and authentication methods. Furthermore, the Tanaza hotspot system enables WiFi users’ data collection which can be used for marketing purposes.
Leverage Google analytics using Tanaza
By using Google Analytics together with the Tanaza splash page, WiFi professionals can understand better WiFi users behaviors by tracking:
- the number of splash page views
- the bounce rate
- the average time spent on the splash page.
How to set up Google analytics tracking with Tanaza
First of all, WiFi administrators need to create a tracking code into the splash page configuration.
Once the Google Analytics account is set up, the splash page details will be registered by Google Analytics.
Why are Google Analytics insights important
WiFi administrators can use Google Analytics insights together with the Tanaza Dashboard to understand the capacity of the splash page to retain WiFi users and transmit a message. Indeed, by comparing the number of daily splash page views with the number of daily WiFi users, administrators will be able to understand if their landing page is clear enough.
A big difference between this data might reflect a problem in the splash page. For example, it could mean that:
The authentication method which is not appropriate
The message on the splash page that is not clear enough for customers, or that the adding-value of a WiFi hotspot is not relevant for customers. We recently published an article about how to build the perfect splash page to retain WiFi users.
The landing page is not effective
Together with the number of splash page views, WiFi administrators should also take into consideration the bounce rate, which is the percentage of visitors to a particular website who navigate away from the site after viewing only one page.
If the bounce rate is high, it means that the landing page is not effective and it does not encourage people to log in to the WiFi hotspot. A high bounce rate might be related to a slow loading splash page because of a low level of bandwidth, but the bounce rate also reflects the interest of customers about a WiFi hotspot. In contrast, a low bounce rate means that customers perceived the WiFi as a value and that they are willing to connect to the internet.

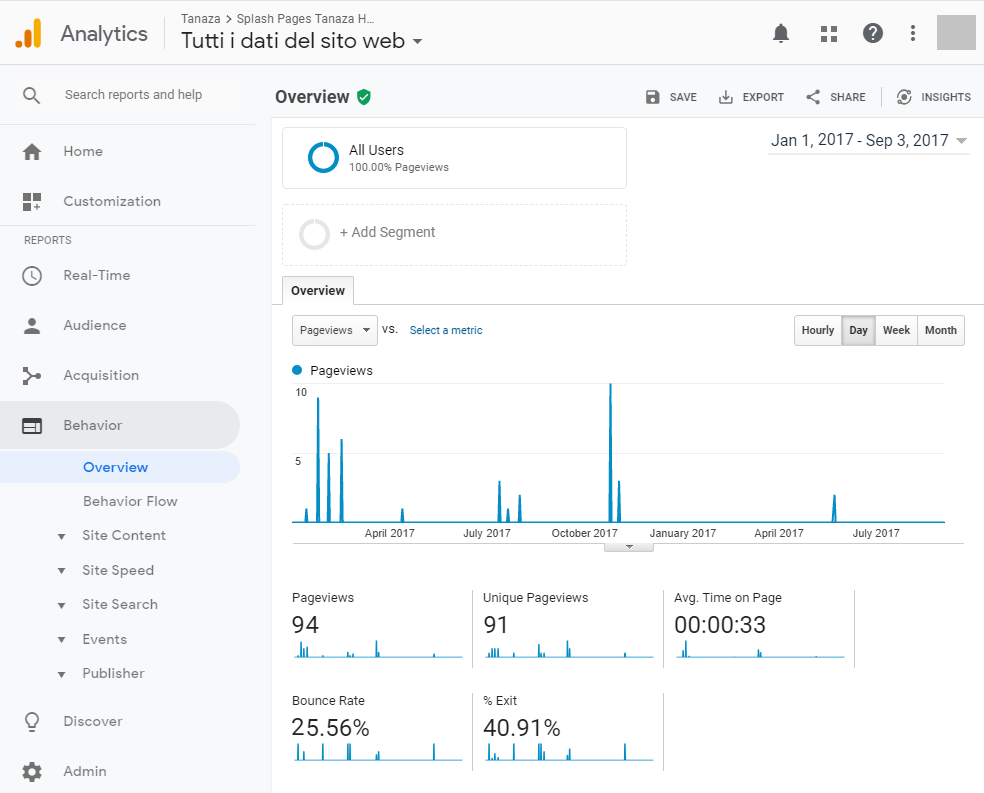
On this screenshot above you can see that there are 94 page views which means that 94 customers visited the splash page of this WiFi hotspot. When comparing this number with the number of WiFi users given by the Tanaza dashboard, you will be able to understand how many users actually connect to the WiFi hotspot. The average time on page is 33 seconds which is good cause it means that the splash page is clear and effective. The bounce rate is low, which reflects the interest of customers for the WiFi hotspot.
By controlling the average time spent on the splash page, WiFi administrators will understand if the invitation to connect to the WiFi hotspot is clear enough. Indeed, a short time session on the splash page means that the user doesn’t get lost in the process and access the internet without any problems. A long time spent on the splash page would show that the message is not clear enough and that maybe the user doesn’t know where to click to access the WiFi network.
To conclude, using monitoring tools such as Google Analytics together with multi-functional platforms like the Tanaza dashboard helps network administrators maximize their WiFi hotspot by underlying common user trends and helping them discover the best practices to engage their target users.
Related articles:
https://www.classichotspot.com/blog/10-good-reasons-to-choose-the-social-login/
